Growsoft India

What is data normalization

What is Data Normalization

What is data normalization

Introduction

In the world of data management and database design, data normalization plays a crucial role in ensuring efficiency, consistency, and accuracy. Whether you are a database administrator, data analyst, or software developer, understanding data normalization is essential for optimizing data storage and improving database performance. In this article, we will explore what data normalization is, why it is important, its benefits, and the various normalization forms used in database design.

What is Data Normalization?

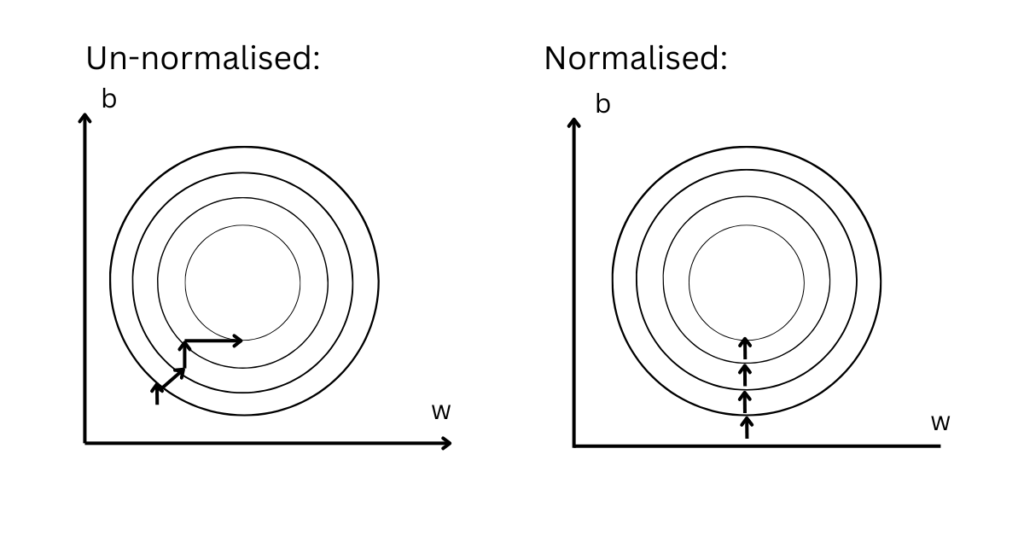
Data normalization is the process of organizing data within a database to minimize redundancy and improve data integrity. It involves structuring a relational database in a way that eliminates duplicate data and ensures that data dependencies are logical. By applying normalization techniques, databases become more efficient, scalable, and easier to maintain.

Normalization is achieved through a series of rules called normal forms. Each normal form builds upon the previous one, progressively refining the database structure to improve its efficiency and eliminate anomalies such as insertion, update, and deletion inconsistencies.

Why is Data Normalization Important?

Data normalization is essential for several reasons, including:

  1. Reducing Data Redundancy – Normalization eliminates duplicate data by ensuring that information is stored only once, thereby reducing storage costs and improving data consistency.
  2. Enhancing Data Integrity – By maintaining proper relationships between data elements, normalization minimizes the risk of inconsistent or conflicting data.
  3. Improving Database Performance – Well-structured databases enable faster query execution, as data is stored in a more organized manner.
  4. Simplifying Data Management – Normalized databases are easier to update and maintain, reducing the likelihood of data anomalies.
  5. Facilitating Scalability – A normalized database structure makes it easier to expand and adapt to changing business needs.

The Different Normal Forms

Normalization is implemented through a series of normal forms, each aimed at improving the structure of the database. The most commonly used normal forms are:

1. First Normal Form (1NF)

A table is in First Normal Form (1NF) if:

  • Each column contains atomic (indivisible) values.
  • Each row has a unique identifier (primary key).
  • There are no duplicate columns.
  • Each column contains values of a single type.

Example: Before 1NF:

StudentIDStudentNameCourses
101AliceMath, Science
102BobHistory, English

After 1NF:

StudentIDStudentNameCourse
101AliceMath
101AliceScience
102BobHistory
102BobEnglish


2. Second Normal Form (2NF)

A table is in Second Normal Form (2NF) if:

  • It is already in 1NF.
  • All non-key attributes are fully dependent on the primary key.

Example: Before 2NF:

OrderIDProductIDProductNameCustomerID
201P001LaptopC101
202P002MouseC102

In the above table, ProductName depends only on ProductID, not on OrderID. To achieve 2NF, we separate product details into another table.

After 2NF: Orders Table:

OrderIDProductIDCustomerID
201P001C101
202P002C102

Products Table:

ProductIDProductName
P001Laptop
P002Mouse

3. Third Normal Form (3NF)

A table is in Third Normal Form (3NF) if:

  • It is in 2NF.
  • There are no transitive dependencies (i.e., non-key attributes should not depend on other non-key attributes).

Example: Before 3NF:

EmployeeIDEmployeeNameDepartmentDepartmentLocation
501JohnHRNew York
502SarahITSan Francisco

Here, DepartmentLocation depends on Department, not directly on EmployeeID. To achieve 3NF, we split the table:

Employees Table:

EmployeeIDEmployeeNameDepartment
501JohnHR
502SarahIT

Departments Table:

DepartmentDepartmentLocation
HRNew York
ITSan Francisco

Higher Normal Forms

Beyond 3NF, there are additional normal forms such as:

  • Boyce-Codd Normal Form (BCNF) – A stricter version of 3NF, eliminating cases where a candidate key is still dependent on another non-prime attribute.
  • Fourth Normal Form (4NF) – Removes multi-valued dependencies.
  • Fifth Normal Form (5NF) – Addresses join dependencies and ensures data reconstruction without anomalies.

Conclusion

Data normalization is a fundamental concept in database design that enhances data integrity, reduces redundancy, and improves overall database efficiency. By applying normalization techniques, organizations can ensure accurate data storage, improve system performance, and streamline data management. Understanding and implementing the right level of normalization is key to designing an optimized and scalable database system.

Supervised Learning

What is Supervised Learning

Supervised Learning

Supervised Learning is one of the fundamental types of machine learning where an algorithm learns from labeled data. In this learning approach, a model is trained using a dataset that contains input features along with their corresponding correct outputs (labels). The goal is to enable the model to make accurate predictions when presented with new, unseen data.

This technique is widely used in various fields such as finance, healthcare, natural language processing, and computer vision. It is particularly useful for problems that require classification or regression analysis.

Key Points

Labeled Data

Supervised learning relies on labeled datasets, meaning that every input instance in the training set has a corresponding correct output label. The model learns the relationship between input features and labels and uses this knowledge to make predictions on new data.

For example:

  • In a spam detection system, an email (input) is labeled as either “spam” or “not spam” (output).
  • In a medical diagnosis system, patient symptoms (input) are mapped to a disease (output).

Labeled datasets are typically created by human experts or through automated labeling systems.


Training Process

Data Collection: The dataset is gathered, including input features and labels.
Data Preprocessing: Data is cleaned, normalized, and divided into training and testing sets.
Model Selection: A suitable algorithm is chosen based on the problem type (classification or regression).
Training the Model: The model is trained using labeled data, adjusting its parameters based on patterns it detects.
Evaluation: The model is tested on unseen data to measure its performance.
Fine-Tuning: The model parameters are optimized to improve accuracy.
The model continues to improve its accuracy through iterative training using optimization techniques such as gradient descent.


 Feedback Mechanism (Loss Function & Optimization)

Mean Squared Error (MSE): Used for regression problems to measure the difference between actual and predicted values.
Cross-Entropy Loss: Used for classification tasks to measure how well the model distinguishes between classes.
Optimization Techniques:

Gradient Descent: Updates model parameters iteratively to reduce the error.
Adam Optimizer: A more advanced optimization method that adjusts learning rates dynamically.
By minimizing the loss function, the model improves its accuracy and prediction capability.


Types of Supervised Learning   
Supervised learning is broadly categorized into:

A. Classification
In classification tasks, the output variable is categorical, meaning it belongs to predefined categories or classes. The goal is to assign input data to one of these categories.

Examples:

Email spam detection (Spam or Not Spam)
Sentiment analysis (Positive, Negative, or Neutral)
Disease diagnosis (Cancer or No Cancer)
B. Regression
In regression tasks, the output is continuous and numerical. The goal is to predict a real-valued number based on input data.


Common Supervised Learning Algorithm

Linear Regression: Used for regression problems, finds a linear relationship between input and output. Logistic Regression: Used for binary classification problems (e.g., spam detection).

Decision Trees: A tree-based model that makes decisions by splitting data into branches.
Random Forest: An ensemble of decision trees that improves prediction accuracy.
Support Vector Machines (SVM): Finds the best decision boundary to classify data points.
Neural Networks: Complex models inspired by the human brain, used for deep learning applications such as image and speech recognition.

For more information visit site – https://en.wikipedia.org/wiki/Supervised_learning

What is Boosting in Machine Learning

What is Boosting in Machine Learning ?

In machine learning, achieving high accuracy and model performance is crucial. While there are many ways to improve the performance of machine learning models, one of the most effective techniques is boosting. Boosting is an ensemble learning technique that combines multiple weak learners into a strong learner to improve predictive accuracy. But what exactly does boosting mean in the context of machine learning? Let’s explore this powerful technique and how it can help you create better machine learning models.


What-is-boosting-in-machine-learning

Boosting is an ensemble learning technique that combines the predictions of several models, called weak learners, to create a single, strong predictive model. The primary objective of boosting is to convert weak learners, which are typically simple models like decision trees, into a highly accurate predictive model by combining their outputs. Unlike other ensemble methods such as bagging (which trains multiple models independently), boosting builds models sequentially. Each subsequent model attempts to correct the errors made by the previous models, allowing the overall model to focus on the most challenging instances.


Key Features of Boosting

Before diving into the process of how boosting works, let’s review some key features that define this technique:

  1. Weak Learners: A weak learner is any model that performs slightly better than random guessing. In boosting, decision trees with limited depth (often referred to as decision stumps) are commonly used as weak learners. Despite being weak individually, when combined, these models can make accurate predictions.

  2. Sequential Learning: Boosting algorithms build models one after another in a sequential manner. Each new model corrects the mistakes of the previous model. This is in contrast to bagging algorithms (like Random Forest) where all models are built in parallel.

  3. Weighting Misclassified Instances: In boosting, the instances that are misclassified by previous models are given higher weights, meaning that the next model in the sequence will focus more on those harder-to-classify instances. This helps improve the overall performance of the model.

  4. Final Prediction: After all models have been trained, they are combined to make a final prediction. Depending on the boosting algorithm, this could involve a weighted average of the predictions (for regression tasks) or a majority vote (for classification tasks).

How Does Boosting Work?

The boosting process involves several iterations where weak learners are trained and combined to improve model accuracy. Let’s go through the process step by step:

  1. Start with a Simple Model: The first model (often a weak learner, like a shallow decision tree) is trained on the dataset. This model will likely make several mistakes, as it is a simple model.

  2. Focus on Mistakes: After the first model makes predictions, boosting algorithms will focus on the data points that were misclassified or have large prediction errors. These points will be given higher weights in the next model’s training process, signaling to the new model that these instances need more attention.

  3. Train the Next Model: The second model is trained to correct the errors of the first model, focusing on the misclassified points. By doing this, the model is iteratively refining the predictions and focusing on the difficult examples.

  4. Repeat the Process: This process of training models to correct the errors of previous ones continues for several iterations. Each model adds value by improving the overall predictions made by the ensemble.

  5. Combine the Models: After all models have been trained, their predictions are combined to make the final prediction. In classification tasks, the final prediction may be determined by a majority vote (the most frequent prediction across all models), while in regression tasks, it could be a weighted average of the predictions from all models.

Common Boosting Algorithms

Several boosting algorithms have been developed over the years. Here are some of the most widely used ones:

1. AdaBoost (Adaptive Boosting)

AdaBoost is one of the earliest and most popular boosting algorithms. It works by adjusting the weights of misclassified instances, so that the next model in the sequence pays more attention to them. AdaBoost is typically used with decision trees as weak learners, but it can also work with other types of models. The key features of AdaBoost are:

  • It starts with equal weights for all training instances.
  • After each iteration, the weights of misclassified instances are increased, forcing the next model to focus on those harder-to-classify points.
  • The final prediction is a weighted sum of the individual model predictions.

Pros: AdaBoost is simple to implement and effective, even for large datasets. It is also less prone to overfitting than some other models.

Cons: AdaBoost can be sensitive to noisy data and outliers, as these can heavily influence the final model.


2. Gradient Boosting

Gradient Boosting is another popular boosting algorithm that works by optimizing a loss function through a series of iterations. Unlike AdaBoost, which uses reweighted instances to focus on misclassified data, Gradient Boosting builds each new model to minimize the residual error (the difference between the predicted and actual values). This is done through gradient descent.

In Gradient Boosting:

  • The algorithm calculates the gradient of the loss function (i.e., the error) and uses this to train the next model.
  • Models are added iteratively to minimize the residual errors of previous models.
  • Final predictions are made by combining the predictions of all models.

Pros: Gradient Boosting can handle complex relationships and produce high-quality models with high accuracy. It’s effective for both regression and classification tasks.

Cons: Gradient Boosting can be slow to train and may be prone to overfitting if not properly tuned.


3. XGBoost (Extreme Gradient Boosting)

XGBoost is an optimized implementation of Gradient Boosting, designed to be faster and more efficient. It is highly popular in machine learning competitions due to its speed and accuracy.

Key features of XGBoost include:

  • Regularization: XGBoost incorporates regularization techniques to avoid overfitting, making it more robust.
  • Parallelization: XGBoost can train models much faster than traditional Gradient Boosting by parallelizing the process.
  • Handling Missing Data: XGBoost can handle missing data, making it more flexible in real-world applications.

Pros: XGBoost is highly efficient, performs well on structured datasets, and has a range of hyperparameters to fine-tune for optimal performance.

Cons: XGBoost requires careful hyperparameter tuning and can be computationally expensive for large datasets.


Why is Boosting Important?

Boosting is an essential technique in machine learning because it significantly enhances the performance of weak models. Here are some reasons why boosting is widely used:

  • Increased Accuracy: By combining multiple weak models, boosting creates a stronger model that can make more accurate predictions, especially on difficult datasets.
  • Better Handling of Imbalanced Datasets: Boosting can focus on harder-to-classify instances, which helps improve accuracy when dealing with imbalanced datasets.
  • Effective for Complex Problems: Boosting is effective at learning complex patterns and relationships in the data, making it ideal for challenging problems.

What is EDA ?

What is EDA ?

What is EDA ?

Exploratory data analysis (EDA) is used by data scientists to analyze and investigate data sets and summarize their main characteristics, often employing data visualization methods.

EDA helps determine how best to manipulate data sources to get the answers you need, making it easier for data scientists to discover patterns, spot anomalies, test a hypothesis, or check assumptions.

EDA is primarily used to see what data can reveal beyond the formal modeling or hypothesis testing task and provides a provides a better understanding of data set variables and the relationships between them. It can also help determine if the statistical techniques you are considering for data analysis are appropriate. Originally developed by American mathematician John Tukey in the 1970s, EDA techniques continue to be a widely used method in the data discovery process today.

Why is EDA Important in Data Science ?

The main purpose of EDA is to help look at data before making any assumptions. It can help identify obvious errors, as well as better understand patterns within the data, detect outliers or anomalous events, find interesting relations among the variables.

Data scientists can use exploratory analysis to ensure the results they produce are valid and applicable to any desired business outcomes and goals. EDA also helps stakeholders by confirming they are asking the right questions. EDA can help answer questions about standard deviations, categorical variables, and confidence intervals. Once EDA is complete and insights are drawn, its features can then be used for more sophisticated data analysis or modeling, including machine learning.


What is EDA ?


EDA Tools

Specific statistical functions and techniques you can perform with EDA tools include : 

  • Clustering and dimension reduction techniques, which help create graphical displays of high-dimensional data containing many variables.

  • Univariate visualization of each field in the raw dataset, with summary statistics.

  • Bivariate visualizations and summary statistics that allow you to assess the relationship between each variable in the dataset and the target variable you’re looking at.

  • Multivariate visualizations, for mapping and understanding interactions between different fields in the data.

  • K-means clustering, which is a clustering method in unsupervised learning where data points are assigned into K groups, i.e. the number of clusters, based on the distance from each group’s centroid. The data points closest to a particular centroid will be clustered under the same category. K-means clustering is commonly used in market segmentation, pattern recognition, and image compression.

  • Predictive models, such as linear regression, use statistics and data to predict outcomes. 


EDA Techniques

Some of the common techniques and methods used in Exploratory Data Analysis include the following:

Data Visualization

Data visualization involves generating visual representations of the data using graphs, charts, and other graphical techniques. Data visualization enables a quick and easy understanding of patterns and relationships within data. Visualization techniques include scatter plots, histograms, heatmaps and box plots

Correlation Analysis

Using correlation analysis, one can analyze the relationships between pairs of variables to identify any correlations or dependencies between them. Correlation analysis helps in feature selection and in building predictive models. Common correlation techniques include Pearson’s correlation coefficient, Spearman’s rank correlation coefficient and Kendall’s tau correlation coefficient.

Dimensionality Reduction

In dimensionality reduction, techniques like principal component analysis (PCA) and linear discriminant analysis (LDA) are used to decrease the number of variables in the data while keeping as many details as possible.

Descriptive Statistics

It involves calculating summary statistics such as mean, median, mode, standard deviation and variance to gain insights into the distribution of data. The mean is the average value of the data set and provides an idea of the central tendency of the data. The median is the mid-value in a sorted list of values and provides another measure of central tendency. The mode is the most common value in the data set.

Clustering

Clustering techniques such as K-means clustering, hierarchical clustering, and DBSCAN clustering help identify patterns and relationships within a dataset by grouping similar data points together based on their characteristics.

Outlier Detection

Outliers are data points that vary or deviate significantly from the rest of the data and can have a crucial impact on the accuracy of models. Identifying and removing outliers from data using methods like Z-score, interquartile range (IQR) and box plots method can help improve the data quality and the models’ accuracy.


Types Of EDA

Univariate non-graphical

This is simplest form of data analysis, where the data being analyzed consists of just one variable. Since it’s a single variable, it doesn’t deal with causes or relationships. The main purpose of univariate analysis is to describe the data and find patterns that exist within it.

Univariate graphical

Non-graphical methods don’t provide a full picture of the data. Graphical methods are therefore required. Common types of univariate graphics include:

  • Stem-and-leaf plots, which show all data values and the shape of the distribution.
  • Histograms, a bar plot in which each bar represents the frequency (count) or proportion (count/total count) of cases for a range of values.
  • Box plots, which graphically depict the five-number summary of minimum, first quartile, median, third quartile, and maximum.
Multivariate non-graphical

Multivariate data arises from more than one variable. Multivariate non-graphical EDA techniques generally show the relationship between two or more variables of the data through cross-tabulation or statistics.

Multivariate graphical

Multivariate data uses graphics to display relationships between two or more sets of data. The most used graphic is a grouped bar plot or bar chart with each group representing one level of one of the variables and each bar within a group representing the levels of the other variable.

Other common types of multivariate graphics include:

  • Scatter plot, which is used to plot data points on a horizontal and a vertical axis to show how much one variable is affected by another.
  • Multivariate chart, which is a graphical representation of the relationships between factors and a response.
  • Run chart, which is a line graph of data plotted over time.
  • Bubble chart, which is a data visualization that displays multiple circles (bubbles) in a two-dimensional plot.
  • Heat map, which is a graphical representation of data where values are depicted by color.

Exploratory Data Analysis Languages

Some of the most common data science programming languages used to create an EDA include:

   Python :
  • An interpreted, object-oriented programming language with dynamic semantics. Its high-level, built-in data structures, combined with dynamic typing and dynamic binding, make it very attractive for rapid application development, as well as for use as a scripting or glue language to connect existing components together. Python and EDA can be used together to identify missing values in a data set, which is important so you can decide how to handle missing values for machine learning.

      R :

  • An open-source programming language and free software environment for statistical computing and graphics supported by the R Foundation for Statistical Computing. The R language is widely used among statisticians in data science in developing statistical observations and data analysis.
Data-Lake

What is Data Lake? 6 Powerful Benefits & Best Practices

What is Data Lake?

A Data Lake is a centralized storage system that holds structured, semi-structured, and unstructured data at any scale. Unlike traditional databases, Data Lakes allow raw data to be stored without the need for prior organization.


🔹 Why it is Important?

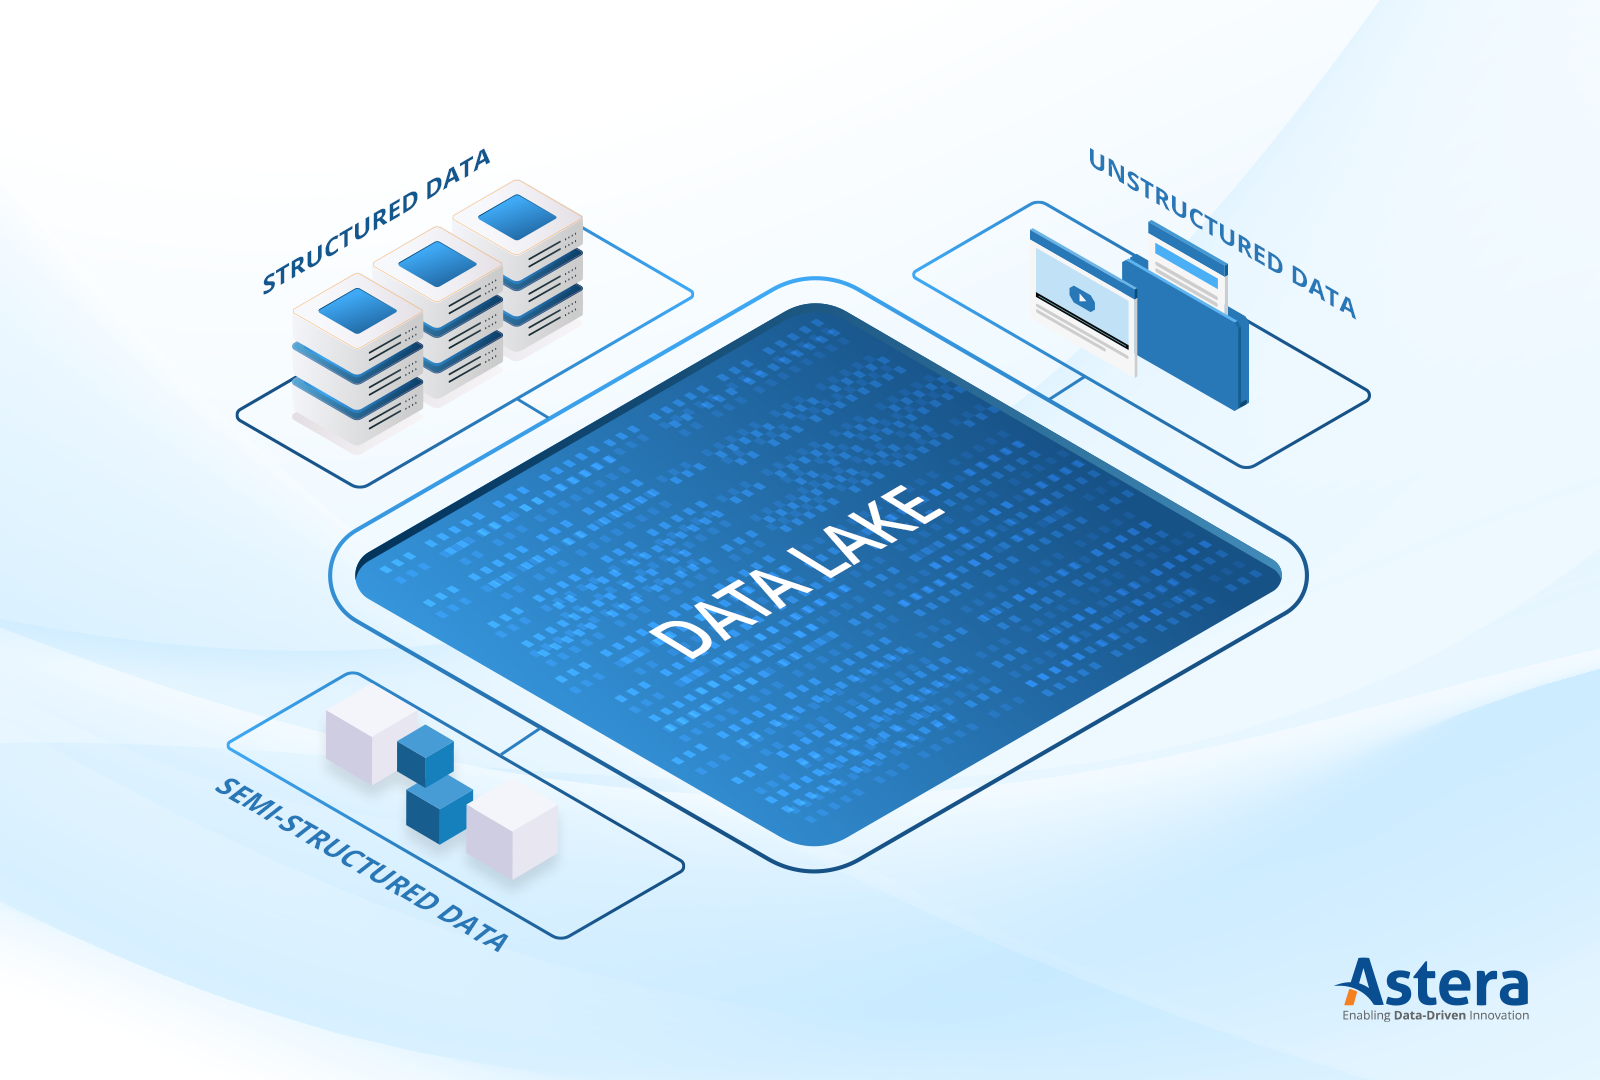
✔️ Handles structured, semi-structured, and unstructured data
✔️ Supports advanced analytics, AI, and ML
✔️ Scalable and cost-effective storage solution
✔️ Enables real-time data processing


Key Components of a Cloud-based Data Lake Architecture

A Data Lake is built using multiple components to ensure efficient data storage, processing, and analysis.

1️⃣ Data Ingestion Layer 🏗️

This layer is responsible for importing data from various sources, including:
✅ Databases (SQL, NoSQL)
✅ APIs & Web Services
✅ Streaming Data (Kafka, Apache Flink)
✅ IoT & Sensor Data

2️⃣ Storage Layer 💾

The storage layer is where data is stored in its raw form. Popular storage options include:
✅ Cloud Storage – AWS S3, Azure Data Lake, Google Cloud Storage
✅ On-Premises Storage – Hadoop Distributed File System (HDFS)

3️⃣ Processing & Analytics Layer 📊

This layer enables data transformation and analysis through:
✅ Big Data Processing (Apache Spark, Hadoop, Presto)
✅ Machine Learning & AI (TensorFlow, PyTorch, AWS SageMaker)
✅ SQL Queries & BI Tools (Power BI, Tableau, Looker)

4️⃣ Security & Governance Layer 🔒

This layer ensures data security, compliance, and governance using:
✅ Role-Based Access Control (RBAC)
✅ Data Encryption & Masking
✅ Data Cataloging & Metadata Management

5️⃣ Consumption Layer 🔍

This layer allows users to access and utilize data through:
✅ APIs & SDKs for developers
✅ Business Intelligence (BI) dashboards
✅ Machine Learning models for predictions

 Data Lake vs. Data Warehouse: What’s the Difference?

FeatureData Lake 🏞️Data Warehouse 🏛️
Data TypeRaw, unstructured, semi-structuredProcessed, structured
ProcessingAI, ML, real-time & batch analyticsBusiness Intelligence (BI), reporting
SchemaSchema-on-read (defined at query time)Schema-on-write (structured before storage)
Storage CostLower (uses scalable cloud storage)Higher (structured storage requires indexing)
Best ForBig data, AI, machine learning, IoTFinancial reports, KPI tracking, business dashboards
stp

 Top Benefits of a Enterprise Data Lake

✅ Stores All Data Types – Structured, semi-structured, and unstructured.
✅ Scalability – Can handle petabytes of data efficiently.
✅ Flexibility – No need to structure data before storage.
✅ Cost-Effective – Uses low-cost cloud storage (AWS S3, Azure Blob Storage).
✅ Advanced Analytics – AI, ML, and Big Data processing capabilities.
✅ Real-Time & Batch Processing – Supports fast decision-making.


Common Challenges in Managing a Big Data Lake

🚨 Data Swamp Problem – If not properly managed, a Data Lake can become a “data swamp” (unorganized and unusable).
✔ Solution: Implement metadata tagging and data governance policies.

🚨 Security Risks – Storing raw data without security measures can lead to breaches and compliance violations.
✔ Solution: Use role-based access control (RBAC), encryption, and logging.

🚨 Slow Query Performance – Large volumes of raw data can slow down analytics.
✔ Solution: Use indexing, caching, and data partitioning for optimization.


 Popular Data Lake Platforms & Tools

🌐 Cloud-Based Data Lakes

✅ AWS Data Lake (Amazon S3 + AWS Glue) – Scalable, AI-ready.
✅ Azure Data Lake Storage (ADLS) – Microsoft ecosystem integration.
✅ Google Cloud Storage (GCS) + BigQuery – Fast SQL-based analytics.

💻 Open-Source Data Lake Solutions

✅ Apache Hadoop & Spark – Distributed storage & big data processing.
✅ Delta Lake – Optimized data lakehouse architecture.


 Real-World Use Cases of Data Lakes

💡 E-Commerce – Customer behavior analysis, recommendation systems.
💡 Healthcare – Medical imaging, genomics research, AI-driven diagnostics.
💡 Finance – Fraud detection, real-time transaction monitoring.
💡 Manufacturing – IoT-based predictive maintenance.
💡 Retail & Supply Chain – Demand forecasting, inventory optimization.


 Best Practices for Managing a Data Lake Storage

✔ Define Data Governance Policies – Helps prevent data swamps.
✔ Implement Data Security – Use encryption & role-based access control.
✔ Optimize Query Performance – Use indexing, caching, and partitioning.
✔ Ensure Data Quality – Maintain metadata tagging and validation rules.
✔ Use Cost Optimization Strategies – Store rarely accessed data in lower-cost tiers.


It’s Future: What’s Next?

🔮 Data Lakehouses – A hybrid model combining Data Lake & Data Warehouse capabilities.
🔮 AI-Powered Data Lakes – Using machine learning for automatic data classification.
🔮 Real-Time Data Lakes – Enabling instant data processing & decision-making.
🔮 Edge Data Lakes – Storing & processing IoT data closer to the source.

Software Testing

                 Introduction to Software Testing


Software testing is a critical phase in the software development lifecycle (SDLC) that ensures the quality, functionality, security, and reliability of a software application. It involves evaluating and verifying that a software product meets the specified requirements and performs as expected.

Software Testing
What is Software Testing?

Software testing is the process of executing a software application to identify defects, errors, or missing requirements. The primary goal is to ensure that the software functions correctly under different conditions and meets user expectations.

Importance of Software Testing
  1. Ensures Quality – Detects and fixes defects before deployment.
  2. Enhances Security – Identifies vulnerabilities to prevent security breaches.
  3. Improves Performance – Ensures the application runs efficiently under different workloads.
  4. Ensures Compliance – Helps meet industry and regulatory standards.
  5. Increases Customer Satisfaction – Ensures a bug-free experience for end-users.
Types of Software Testing

Software testing is broadly classified into two types:

1. Manual Testing

Testing conducted by a human without automation tools. It includes:

  • Exploratory Testing – Tester explores the application without predefined test cases.
  • Ad-hoc Testing – Random testing without a structured test plan.
2. Automated Testing

Testing conducted using automation tools to increase efficiency. It includes:

  • Unit Testing – Testing individual components of the software.
  • Integration Testing – Ensuring that different modules work together.
  • System Testing – Testing the complete system against requirements.
  • Regression Testing – Ensuring new changes don’t break existing functionality.
Levels of Software Testing
  1. Unit Testing – Tests individual units of the code.
  2. Integration Testing – Tests interactions between modules.
  3. System Testing – Tests the entire application as a whole.
  4. Acceptance Testing – Validates the software with real-world scenarios before release
Software Testing Methodologies
  1. Black Box Testing – Tests software functionality without looking at the internal code.
  2. White Box Testing – Tests internal structures and logic of the code.
  3. Grey Box Testing – A mix of both black and white box testing.
Software Testing
Common Software Testing Tools
  • Selenium (for web application automation)
  • JUnit (for Java unit testing)
  • TestNG (for advanced testing frameworks)
  • Appium (for mobile application testing)
  • LoadRunner (for performance testing)
 Levels of Software Testing
  • Unit Testing: Tests individual components/modules of software.
  • Integration Testing: Verifies interactions between integrated modules.
  • System Testing: Tests the complete system as a whole.
  • Acceptance Testing: Ensures the software meets business requirements.
 Functional vs. Non-Functional Testing
  • Functional Testing: Ensures software performs its intended functions.
  • Non-Functional Testing: Checks performance, usability, security, etc.
  Common Testing Methods
  • Regression Testing: Ensures new changes don’t affect existing functionality.
  • Smoke Testing: Basic testing to check if critical functionalities work.
  • Sanity Testing: A quick test to verify small changes in functionality.
  • Performance Testing: Evaluates speed, stability, and scalability.
  • Security Testing: Identifies vulnerabilities and threats.
  • Usability Testing: Checks user-friendliness and accessibility.
What is the purpose of software testing?

To check if the software works well, runs faster, and makes users satisfied.

What is a software testing tool?

The tools that are used for the testing of software.

Which testing is best?

Unit tests

Data Analyst 2024

The Rise of Data Analysts in 2024: A Growing Career Path

In 2024, the demand for data analysts is reaching new heights. With businesses generating vast amounts of data every day, professionals who can analyze and interpret this data are becoming essential for success. A data analyst’s role involves gathering, processing, and making sense of data to help companies make better decisions.


Why Data Analysts are in Demand

Data plays a crucial role in almost every industry—from finance to healthcare. In 2024, companies need data analysts to:

  • Identify trends: Spot patterns in data that can improve business strategies.
  • Make decisions: Help leaders understand what’s working and what’s not.
  • Predict the future: Use data to forecast trends and customer behavior.

With the growth of technologies like AI, data analysts are more valuable than ever before.


What Does a Data Analyst Do?

A data analyst works with numbers, charts, and reports to turn raw data into useful insights. Some common tasks include:

  • Collecting data from different sources.
  • Cleaning data to remove errors and inconsistencies.
  • Analyzing data to find trends and patterns.
  • Creating reports to show the results in a simple way.

Skills Needed to Become a Data Analyst

  • Strong math and statistical skills: To understand and work with numbers.
  • Knowledge of tools like Excel, SQL, and Python: To manage and analyze data.
  • Problem-solving ability: To find the best way to use data to improve business performance.

Frequently Asked Questions (FAQs) About Data Analysts

1. What is a Data Analyst?

A data analyst is a professional who collects, processes, and analyzes data to help organizations make informed decisions. They use various tools and techniques to transform raw data into actionable insights that can guide business strategies.

2. What does a Data Analyst do on a daily basis?

On a typical day, a data analyst:

  • Gathers data from multiple sources.
  • Cleans and organizes data to remove inconsistencies.
  • Analyzes data using statistical methods or specialized software.
  • Creates reports, dashboards, and visualizations to present findings.
  • Collaborates with teams to help solve business problems using data insights.

3. What skills are required to become a Data Analyst?

To become a successful data analyst, you need:

  • Mathematical and statistical skills: For data analysis.
  • Programming knowledge: In languages like SQL, Python, or R.
  • Data visualization tools: Experience with tools like Tableau or Power BI.
  • Problem-solving abilities: To derive insights from data.
  • Attention to detail: For cleaning and validating data.

4. What are the common tools used by Data Analysts?

Data analysts often use:

  • Excel: For data manipulation and simple analysis.
  • SQL: To query databases.
  • Python/R: For advanced data analysis and automation.
  • Tableau/Power BI: For creating visualizations and dashboards.
  • Google Analytics: For analyzing web traffic and user behavior.

5. What industries hire Data Analysts?

Almost every industry hires data analysts, including:

  • Finance: For risk management and investment analysis.
  • Healthcare: To improve patient outcomes and operational efficiency.
  • Retail: For customer behavior analysis and inventory management.
  • Marketing: For campaign analysis and optimization.
  • Technology: For product development and performance tracking.

6. What is the difference between a Data Analyst and a Data Scientist?

While both roles work with data:

  • Data Analysts focus on collecting, analyzing, and interpreting existing data to find trends and insights.
  • Data Scientists go further by building models and algorithms to predict future trends and automate processes using machine learning techniques.

7. How much does a Data Analyst typically earn?

Salaries vary based on experience, location, and industry. On average:

  • Entry-level data analysts may earn around $50,000 – $65,000 per year.
  • Mid-level data analysts typically earn between $65,000 – $85,000 per year.
  • Senior data analysts can earn $85,000 – $110,000+ annually, with potential bonuses.

8. What education is required to become a Data Analyst?

A bachelor’s degree in a related field, such as mathematics, statistics, computer science, or business, is common. Many data analysts also pursue additional certifications in data analytics or programming languages.

9. How can I become a Data Analyst with no experience?

  • Start by learning the key skills: Excel, SQL, and basic programming.
  • Take online courses in data analysis and statistics.
  • Work on real-world projects (e.g., internships, personal data projects) to build a portfolio.
  • Consider earning certifications in data analytics from platforms like Coursera, Udemy, or Google.

10. What are the future trends for Data Analysts?

The demand for data analysts is expected to grow as more businesses rely on data to drive decisions. Emerging trends include:

  • Increased use of artificial intelligence and machine learning in data analysis.
  • Automation of routine tasks using advanced tools.
  • Greater emphasis on real-time data analysis for faster decision-making.

11. Is Data Analytics a good career choice?

Yes, data analytics is an excellent career choice, offering high demand, competitive salaries, and opportunities in various industries. With businesses increasingly relying on data-driven decision-making, the field is expected to grow rapidly.

Digital Marketing

The Power of Digital Marketing: How to Leverage It for Your Business

In today’s fast-paced digital age, businesses are no longer confined to traditional marketing methods. Digital marketing has revolutionized how companies engage with customers, drive sales, and build brand awareness. Whether you’re a small startup or a large corporation, understanding and mastering the art of digital marketing is essential to staying competitive.

What is Digital Marketing?

Digital marketing refers to the use of online channels, platforms, and technologies to promote products and services. It includes a broad range of strategies such as:

  • Search Engine Optimization (SEO)
  • Social Media Marketing
  • Email Marketing
  • Content Marketing
  • Pay-Per-Click Advertising (PPC)
  • Affiliate Marketing
  • Analytics and Data Analysis

Key Components of Digital Marketing

  1. Search Engine Optimization (SEO) SEO is the process of optimizing your website so that it ranks higher on search engine results pages (SERPs). When potential customers search for products or services relevant to your business, a well-executed SEO strategy helps them find your website organically.

    • Keyword research: Finding the right keywords your audience is searching for.
    • On-page SEO: Optimizing website elements like meta tags, headings, and internal links.
    • Off-page SEO: Building high-quality backlinks to increase your domain authority.
  2. Content Marketing Content marketing focuses on creating and distributing valuable, relevant content to attract and engage a target audience. This could be in the form of blogs, videos, infographics, podcasts, and eBooks. The goal is to provide useful information that solves the audience’s problems, establishes trust, and encourages conversions.

  3. Social Media Marketing Social media platforms like Facebook, Instagram, LinkedIn, and Twitter are powerful tools for building a community around your brand. By sharing engaging content, running targeted ads, and interacting with followers, you can increase brand loyalty and drive traffic to your website.

  4. Email Marketing Email marketing remains one of the most effective ways to nurture leads and maintain a relationship with existing customers. Personalized emails, targeted promotions, and useful content sent directly to subscribers can significantly boost customer retention and sales.

  5. Pay-Per-Click (PPC) Advertising PPC allows businesses to place ads on platforms like Google Ads, where they only pay when someone clicks on their ad. PPC is a great way to quickly drive traffic to your website while targeting specific demographics or search queries.

  6. Analytics and Data Analysis Monitoring the performance of your digital marketing campaigns is crucial to success. Tools like Google Analytics help you track website traffic, user behavior, conversion rates, and more. By analyzing this data, you can refine your strategy and make data-driven decisions to improve ROI.

Why Digital Marketing is Essential for Business Growth

  • Wider Reach: Digital marketing allows you to reach a global audience, breaking geographical barriers and reaching customers where traditional marketing can’t.
  • Cost-Effective: Compared to traditional marketing methods, digital marketing is more affordable and offers a higher ROI, especially for small businesses.
  • Measurable Results: With digital marketing, you can track the performance of every campaign in real-time, allowing you to optimize for better results.
  • Personalization: Tailor your messages and offers to specific audiences for more effective marketing.
  • Enhanced Engagement: Build stronger connections with your audience through social media interactions, personalized email campaigns, and engaging content.

How to Build a Successful Digital Marketing Strategy

  1. Define Clear Goals
    Before diving into digital marketing, it’s essential to set specific, measurable, achievable, relevant, and time-bound (SMART) goals. Whether it’s increasing website traffic, improving brand awareness, or generating leads, having clear objectives will guide your strategy.

  2. Understand Your Audience
    Knowing who your target audience is and where they spend their time online is crucial. Create buyer personas to help tailor your marketing messages and choose the right platforms for your campaigns.

  3. Create High-Quality Content
    Content is king in digital marketing. Focus on creating valuable, informative, and engaging content that addresses the needs of your audience. Whether it’s blog posts, videos, or social media updates, content should be at the heart of your strategy.

  4. Leverage Multiple Channels
    An effective digital marketing strategy includes a mix of channels such as SEO, social media, email, and paid advertising. Using an omnichannel approach ensures you reach your audience at different touchpoints.

  5. Analyze and Optimize
    Regularly review the performance of your campaigns using analytics tools. Identify what’s working and what needs improvement, and adjust your strategies accordingly.

Supervised Learning

“Mastering Software Testing: A Comprehensive Guide for Quality Assurance”

The Importance of Software Testing

In today’s fast-paced development world, software testing is the backbone of delivering high-quality software products. By identifying and fixing bugs before the software reaches users, businesses can ensure smooth operation and avoid costly issues down the road. In this guide, we’ll explore the various aspects of software testing, its importance, and how you can implement the best testing practices.

software testing

What is Software Testing?

Software testing is the process of evaluating and verifying that a software product meets its expected requirements. This crucial step helps developers identify bugs, security flaws, and performance issues. The ultimate goal of testing is to enhance the software’s quality, functionality, and reliability.

Types of Software Testing

There are several types of software testing that help ensure comprehensive coverage and high-quality results. These include:

  1. Unit Testing: Testing individual units or components of a software.
  2. Integration Testing: Verifying the interaction between integrated units.
  3. Functional Testing: Ensuring the system performs according to its specified functionalities.
  4. Regression Testing: Retesting after updates or changes to check for new issues.
  5. Performance Testing: Assessing the software’s speed, scalability, and stability under load.

Each type of software testing plays a vital role in ensuring that the final product performs as expected.

Best Practices in Software Testing

To improve efficiency and effectiveness, here are some best practices for software testing:

  1. Early Testing: Start testing early in the development lifecycle to detect bugs when they are easier to fix.
  2. Automated Testing: Use automation tools like Selenium or JUnit to speed up repetitive tests.
  3. Continuous Integration: Incorporate continuous testing with each code update to catch issues quickly.
  4. Create Detailed Test Cases: Write clear, detailed test cases that outline the expected results and edge cases.
  5. Use Bug Tracking Systems: Utilize bug tracking tools like Jira to keep records of identified issues and their resolutions.
Supervised Learning

Automated Testing vs. Manual Testing

The debate between automated and manual software testing is ongoing. Both have their advantages:

  • Automated Testing: Best for repetitive, time-consuming tasks. Automation tools execute tests quickly and are ideal for regression and load testing.
  • Manual Testing: Essential for exploratory testing where human insight is necessary. It’s effective for understanding user behavior and testing from a usability standpoint.

FAQ’s: Software Testing


1. What is Software Testing?

Software Testing is the process of evaluating a software application to ensure it meets the specified requirements, works as expected, and is free of bugs. It involves running the software through different test cases to find and resolve errors, enhance performance, and improve overall quality.


2. Why is Software Testing Important?

Software testing is crucial because it:

  • Helps identify and fix bugs before releasing the product to end users.
  • Improves the performance, security, and reliability of the software.
  • Ensures the product meets the business and user requirements.
  • Reduces the risk of costly issues post-launch.

3. What are the Different Types of Software Testing?

There are several types of software testing, including:

  • Unit Testing: Testing individual components of the software.
  • Integration Testing: Verifying the interaction between integrated units.
  • Functional Testing: Ensuring that the software behaves according to the functional requirements.
  • Performance Testing: Assessing software performance under different conditions.
  • Regression Testing: Checking that new changes don’t break existing functionality.
  • User Acceptance Testing (UAT): Ensuring the software works for the end user in real-world scenarios.

4. What is the Difference Between Manual Testing and Automated Testing?

  • Manual Testing: Testers execute test cases manually without using any automation tools. It’s useful for exploratory, usability, and ad-hoc testing.
  • Automated Testing: Test cases are executed automatically using software testing tools such as Selenium, JUnit, and TestNG. Automation is ideal for repetitive tasks like regression testing and large-scale projects that need continuous testing.

5. What Tools are Used in Software Testing?

Common software testing tools include:

  • Selenium: For web application automation.
  • JUnit: For unit testing in Java applications.
  • TestRail: Test case management tool.
  • Jira: Used for bug tracking and project management.
  • LoadRunner: For performance testing.

6. What is the Role of a QA Tester?

A QA (Quality Assurance) Tester is responsible for designing test cases, executing them, identifying bugs, and working with developers to resolve issues. They ensure the software meets the expected standards and is free of errors before release.


7. What is Regression Testing?

Regression Testing involves retesting the software after changes (like bug fixes or new features) to ensure that no new bugs were introduced, and that the existing functionality is still intact.


8. When Should Software Testing Start in the Development Lifecycle?

It’s best to start software testing as early as possible in the development process. This is known as Shift-Left Testing, where testing begins in the early stages, such as during requirement analysis and design, to identify issues early and reduce costs associated with fixing bugs later in development.


9. What is the Difference Between Functional and Non-Functional Testing?

  • Functional Testing: Tests whether the software functions according to the business requirements (e.g., user interactions, inputs, and outputs).
  • Non-Functional Testing: Tests other aspects of the software such as performance, security, and scalability (e.g., how many users the system can handle, how fast the system responds).

10. What is User Acceptance Testing (UAT)?

User Acceptance Testing is the final phase of software testing, where the software is tested in real-world scenarios by the intended users or clients. It ensures the software meets the business needs and is ready for deployment.


11. What are Test Cases in Software Testing?

A test case is a specific scenario or condition under which a tester will determine whether the software behaves as expected. Test cases include:

  • Test inputs
  • Execution steps
  • Expected outcomes
  • Actual results

Test cases guide testers in systematically verifying software functionality.


12. What is Bug Tracking in Software Testing?

Bug tracking is the process of identifying, recording, and managing bugs or defects found during software testing. Tools like Jira and Bugzilla are used to track and manage bugs from discovery to resolution.

The Rise of Continuous Testing in DevOps

In today’s fast-paced software development landscape, speed and quality are no longer mutually exclusive. Continuous Testing in DevOps is emerging as a critical practice that allows organizations to release software faster while ensuring high-quality standards. As DevOps practices prioritize automation, collaboration, and continuous delivery, continuous testing fits perfectly into the ecosystem by enabling instant feedback on code quality, performance, and security at every stage of the development pipeline.

What is Continuous Testing in DevOps?

Continuous Testing is the process of executing automated tests as part of the software delivery pipeline to ensure that every build meets the desired quality standards. It provides rapid feedback to developers and testers, helping identify bugs and issues early in the development cycle.

In DevOps, continuous testing integrates with Continuous Integration (CI) and Continuous Delivery (CD) pipelines, allowing teams to automate the testing process from unit testing to end-to-end testing, performance testing, and security testing.

By incorporating continuous testing, teams can maintain agility, reduce manual efforts, and ensure that software updates are thoroughly tested and stable before being deployed to production.

Web Development

The Importance of Continuous Testing in DevOps

With the DevOps model emphasizing fast iterations and frequent releases, continuous testing ensures that quality keeps pace with speed. Here’s why continuous testing in DevOps is crucial:

  1. Faster Time to Market: Automating the testing process accelerates the entire development cycle, reducing the time it takes to get features and updates into the hands of users.

  2. Early Detection of Bugs: Continuous testing helps in identifying defects early in the process, minimizing the cost and effort required to fix them later.

  3. Improved Collaboration: Continuous testing fosters collaboration between development, operations, and quality assurance teams by integrating testing with the CI/CD pipeline.

  4. Reduced Risk: Frequent testing mitigates the risk of critical bugs making their way to production, which enhances the stability and reliability of the product.

  5. Consistent Feedback: Continuous testing ensures that feedback on code quality is provided in real-time, helping developers address issues immediately.


How Continuous Testing Fits into the DevOps Pipeline

In the traditional development lifecycle, testing typically happens in the later stages, often leading to delays. In DevOps, continuous testing is fully integrated into the pipeline, ensuring that testing happens at every stage:

  1. Code Commit (CI): Once a developer commits code, automated unit tests are triggered to check the code quality and functionality at the component level.

  2. Build Verification: During the build stage, integration tests run to verify that the components work together as expected.

  3. Functional and Regression Testing: As the pipeline progresses, automated functional and regression tests ensure that new changes do not negatively affect existing features.

  4. Performance Testing: Tools like JMeter or LoadRunner can be integrated to test the scalability and performance of the application under various load conditions.

  5. Security Testing: Continuous testing in DevOps also includes automated security tests using tools like OWASP ZAP or SonarQube to identify potential vulnerabilities early on

Benefits of Continuous Testing in DevOps

  1. Shorter Development Cycles: By running automated tests continuously, development teams can achieve faster cycles without sacrificing quality.

  2. Better Quality Assurance: Continuous testing ensures that testing isn’t just an afterthought but an ongoing process. This improves the overall quality of the software by identifying and resolving issues quickly.

  3. Higher Test Coverage: Automated tests run at every stage of the pipeline ensure more extensive test coverage than manual testing, including edge cases and under high loads.

  4. Reduced Costs: Detecting and fixing bugs early in the development process is much more cost-effective than identifying them after production deployment.

  5. Higher Confidence in Releases: By the time the product is ready for deployment, continuous testing gives teams the confidence that the software is fully vetted, reducing the chances of deployment failures.

Challenges of Implementing Continuous Testing in DevOps

While continuous testing in DevOps provides significant benefits, there are a few challenges teams may face:

  1. Tool Integration: It can be challenging to integrate various testing tools into the CI/CD pipeline. Choosing the right tools that seamlessly integrate into your pipeline is essential.

  2. Test Automation Expertise: Implementing effective continuous testing requires strong knowledge of test automation frameworks, which might be a skill gap in some teams.

  3. Maintenance of Test Scripts: As the application evolves, maintaining the test scripts can be time-consuming and require continuous updates to keep up with code changes.

  4. Test Environment Management: Managing multiple test environments (staging, development, production) and ensuring they are consistent can be a challenge.

  5. False Positives/Negatives: Incorrectly written test scripts can lead to false positives or negatives, which may slow down the development pipeline and decrease trust in the test results.