SAMPLING DISTRIBUTION

Sampling Distribution
A sampling distribution is the probability distribution of a statistic (such as the mean, proportion, or standard deviation) obtained from multiple samples drawn from the same population.
In simpler terms, it represents how a sample statistic (like the sample mean) varies when we take multiple samples from the population.
Key Points:
- It is formed by repeatedly selecting samples from a population and calculating a statistic for each sample.
- The shape of the sampling distribution depends on the sample size and the population distribution.
- As the sample size increases, the sampling distribution tends to become more normal due to the Central Limit Theorem (CLT).
Step-by-Step Methods for Sampling Distribution
The process of creating a sampling distribution involves multiple steps, from selecting samples to analyzing their distribution. Here’s a structured step-by-step guide:
Step 1: Define the Population
- Identify the entire group of individuals or data points you want to study.
- Example: A university wants to analyze the average height of all its students.
Step 2: Select a Statistic for Analysis
- Choose a statistic to study, such as: Mean (average), Proportion, Variance
- Example: If we are studying students’ heights, we focus on the mean height.
Step 3: Take Multiple Random Samples
- Randomly select multiple samples from the population, ensuring each sample has the same size (n).
- Example: Take 100 different samples, each containing 50 students.
Step 4: Compute the Sample Statistic
- Calculate the chosen statistic for each sample.
- Example: Compute the average height for each sample of 50 students.
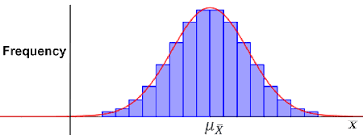
Step 5: Create the Sampling Distribution
- Plot the frequency distribution of the sample statistics (e.g., sample means).
- This forms the sampling distribution of the mean (if studying averages).
Step 6: Analyze the Shape of the Distribution
- The shape of the sampling distribution depends on: Sample size (n), Population distribution, Number of samples
- Key Concept: Central Limit Theorem (CLT)
- If sample size n is large (n ≥ 30), the sampling distribution will be approximately normal (bell-shaped) even if the population is not normally distributed.
Step 7: Calculate the Mean and Standard Error
- The mean of the sampling distribution (μₓ̄) is equal to the population mean (μ).
- The standard deviation of the sampling distribution, called Standard Error (SE)
Step 8: Apply Statistical Inference
- Use the sampling distribution to estimate population parameters and make hypothesis tests.
- Example: If the average sample height is 5.7 feet, we infer the true population mean is around 5.7 feet +- margin of error.

Leave a Reply